
No.2 LIHUA YANG, HANGHUI KONG, JEN-PAN HYANG & MING KANG
Different species or genetically divergent populations? Integrative species delimitation of the Primulina hochiensis complex from isolated karst habitats
Molecular Phylogenetics and Evolution 132 (2019) 219–231
(https://doi.org/10.1016/j.ympev.2018.12.011)
ABSTRACT
To consistently and objectively delineate species-level divergence
from population subdivision has been a challenge in systematics. This is
particularly evident in naturally fragmented and allopatric systems in which
small population size often leads to extreme population structuring. Here we
evaluated the robustness of the species delimitation methods implemented in
BEAST, BPP, and iBPP in the Primulina hochiensis complex
comprising four described and one candidate species (five taxa in total)
distributed in karst landscapes of southern
Here, we just introduced the taxonomic treatment of Primulina hochiensis Complex:
1. Primulina hochiensis (C.C. Huang & X.X. Chen) Mich. Möller & A.Weber in Weber et al. (2011: 782).
Primulina hochiensis var. hochiensis
2. Primulina hochiensis var. rosulata F. Wen & Y.G. Wei in Wen et al. (2012: 37).
≡ Primulina rosulata (F. Wen & Y.G. Wei) Z.L. Ning & X.Y. Zhuang in Ning et al. (2016: 401)
= Primulina tsoongii H.L. Liang, Bo Zhao & Fang Wen in Liang et al. (2014: 75), syn. nov.
3. Primulina hochiensis var. ovata L.H. Yang, H.H. Kong & M. Kang var. nov. (2019: 228)
4. Primulina lianpingensis L.H. Yang, H.H. Kong & M. Kang sp. nov. (2019: 229)
5. Primulina yingdeensis Z.L. Ning, M. Kang & X. Y. Zhuang in Ning et al. (2016: 401)
Original article link:https://www.sciencedirect.com/science/article/pii/S1055790318302732
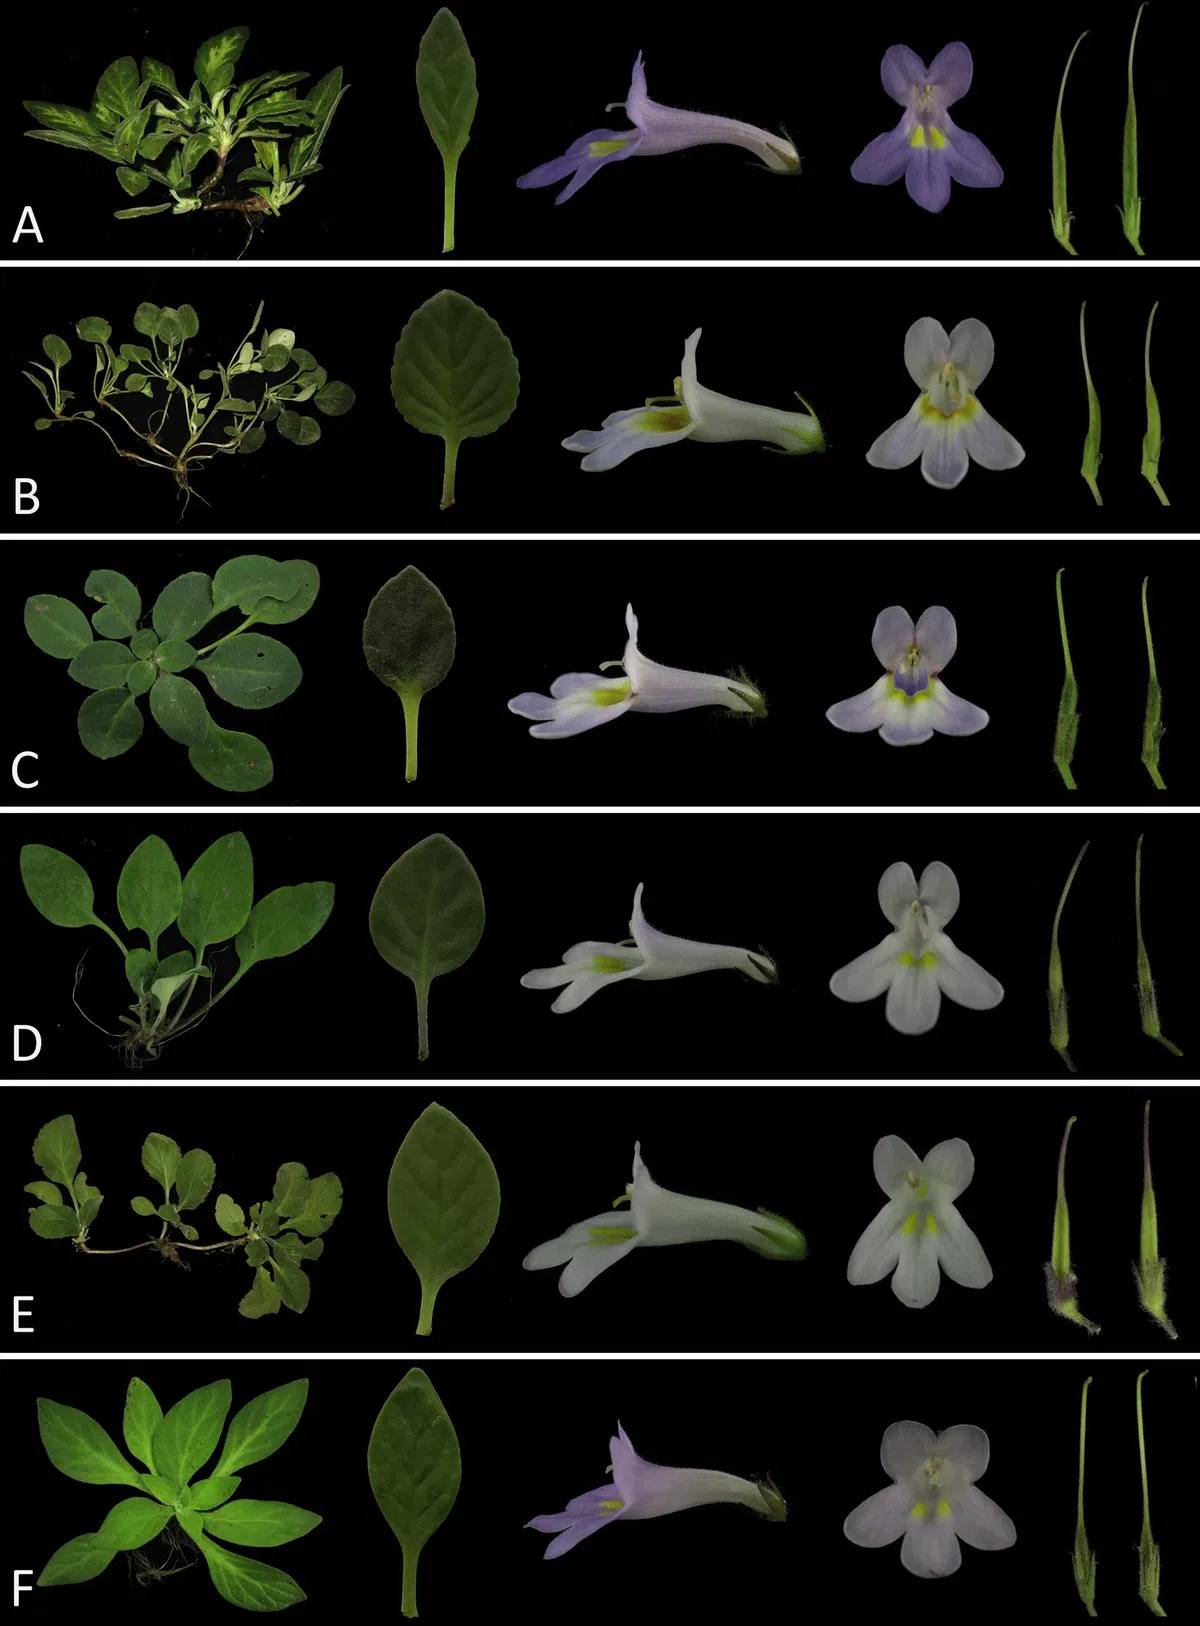
Figure 1Vegetative and reproductive characters of the Primulina hochiensis complex. (A) P. hochiensis-1, (B) P. hochiensis-2, (C) P. tsoongii, (D) P. rosulata, (E) P. yingdeensis, (F) P. lianpingensis. From left to right: habit, leaf, flower in side view, flower in front view and fruit.
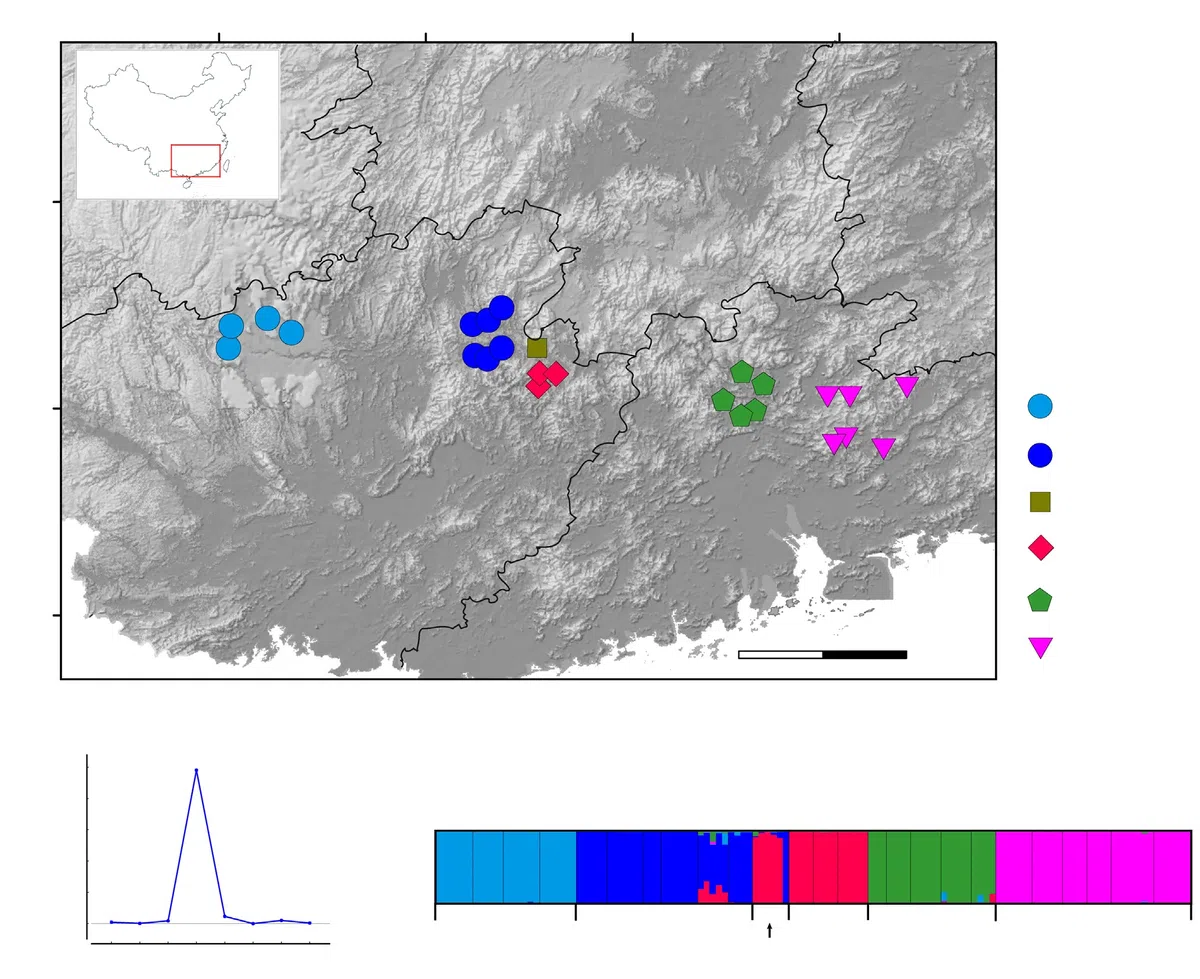
Figure 2(A) Map of the geographic distribution of the Primulina hochiensis complex. Populations are color coded by species. Study region indicated by a rectangle in the upper left corner. (B) Plots of ΔK for each K for nuclear DNA sequence data according to Evanno et al. (2005). (C) Bayesian assignment of 124 individuals using Structure with K=5 of the Primulina hochiensis complex. Each individual is represented by a vertical bar and grouped by population and species. Population names correspond to Table S1.
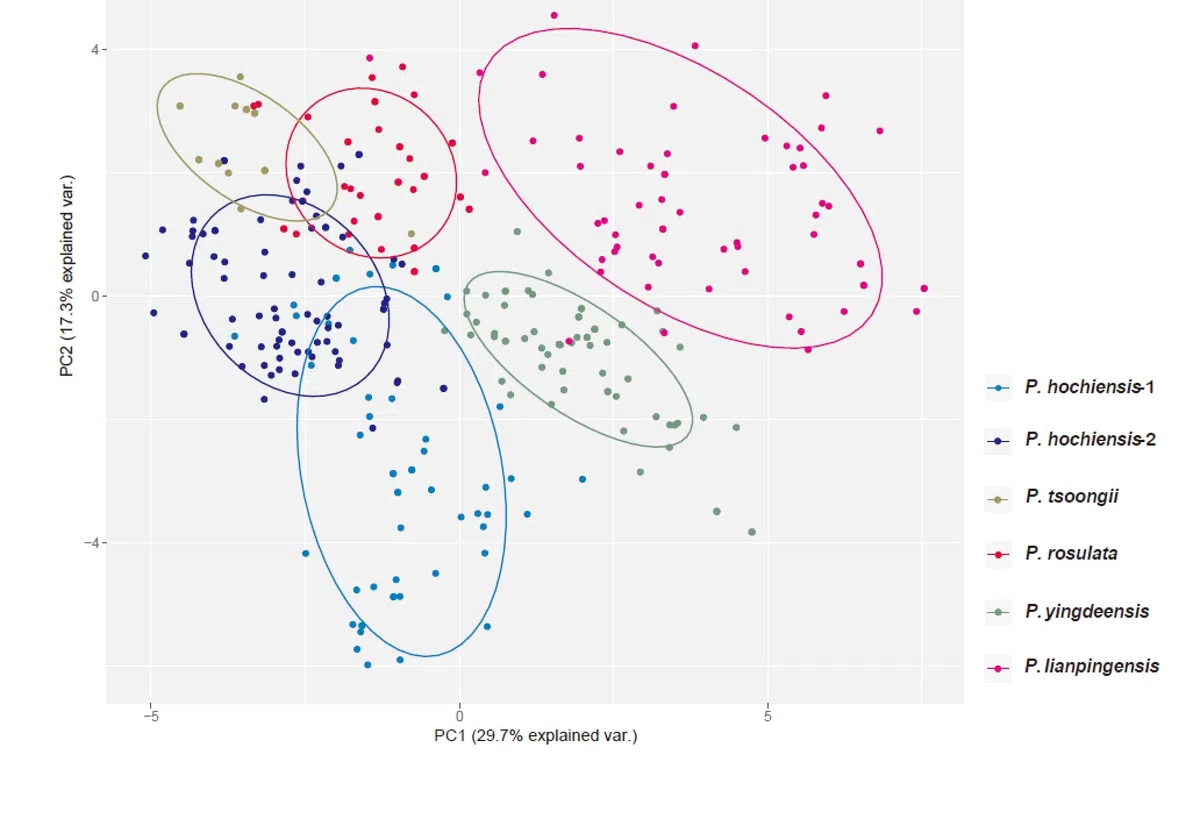
Figure 3Principal components analysis (PCA) of the Primulina hochiensis complex based on 28 morphological traits. Colored symbols represent individuals assigned to different morphological groups and ellipses show 95% high-density regions for normal distributions representing each morphological group.
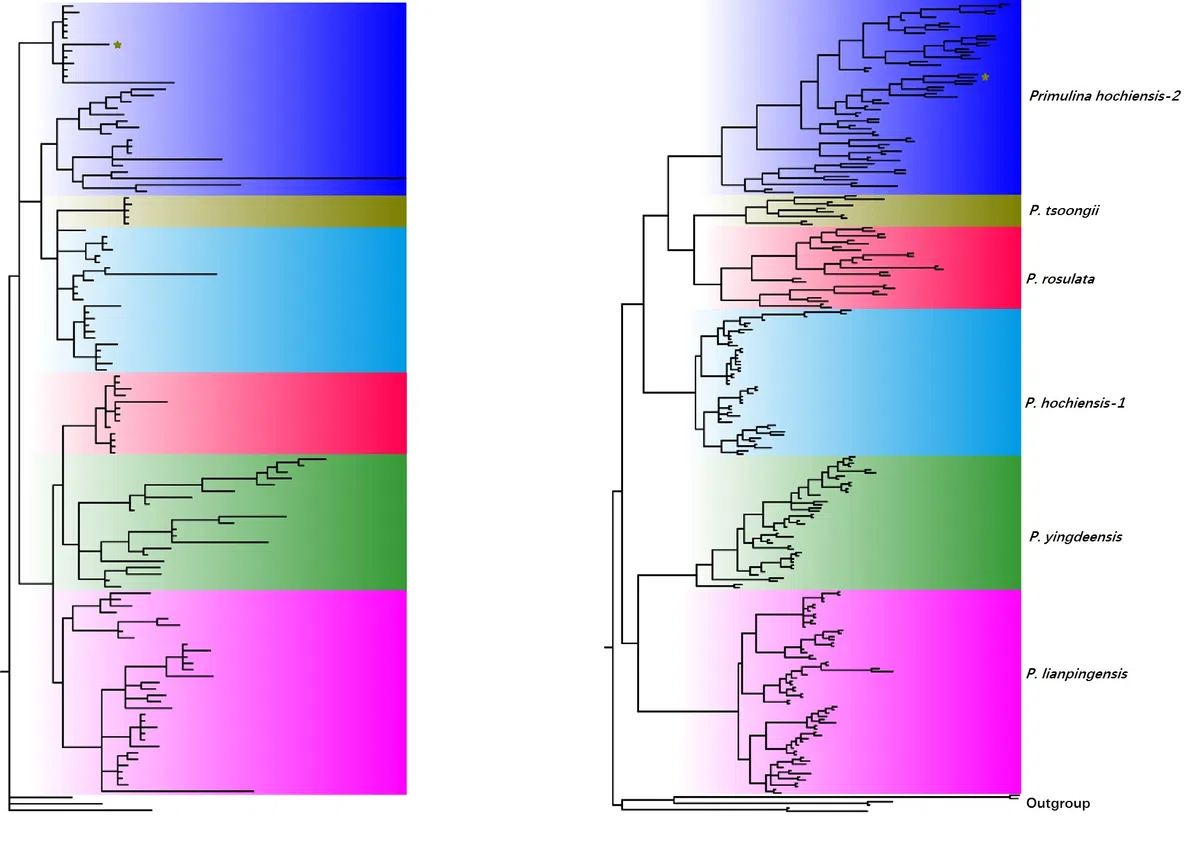
Figure 4 The phylogeny of Primulina hochiensis complex. The gene trees are majority-rule consensus yielded by the MrBayes analysis based on concatenated cpDNA data (A) and nDNA data after phasing (B). The asterisk (*) denotes less than 0.95 posterior probability support. The star marked in the phylogenetic tree indicates an individual of P. tsoongii.
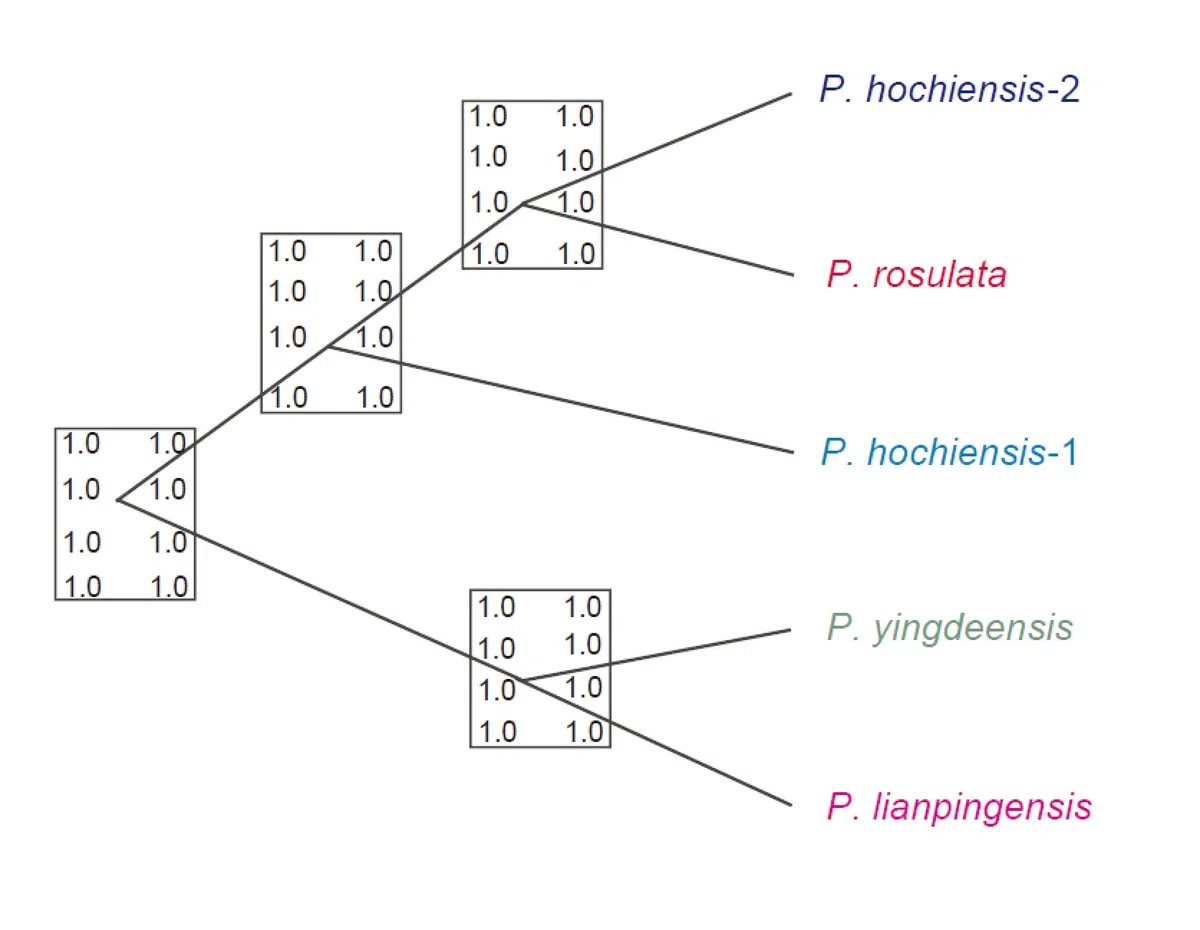
Figure 5 Results from BPP and iBPP analyses using molecular data (for BPP) and combined molecular and morphological data sets (for iBPP). Support values reported for each node are based on the algorithm setting 0 (left) and 1 (right) for the rjMCMC, the algorithm setting for four different priors corresponding to large (vs small) ancestral population sizes with relatively deep (vs shallow divergence times. Specifically, the support values in each box correspond to analyses with the following different priors: from upper to lower, θ=G(1, 10) and τ=G(1, 10); θ=G(1, 10) and τ=G(2, 2000); θ=G(2, 2000) and τ=G(1, 10); θ=G(2, 2000) and τ=G(2, 2000).
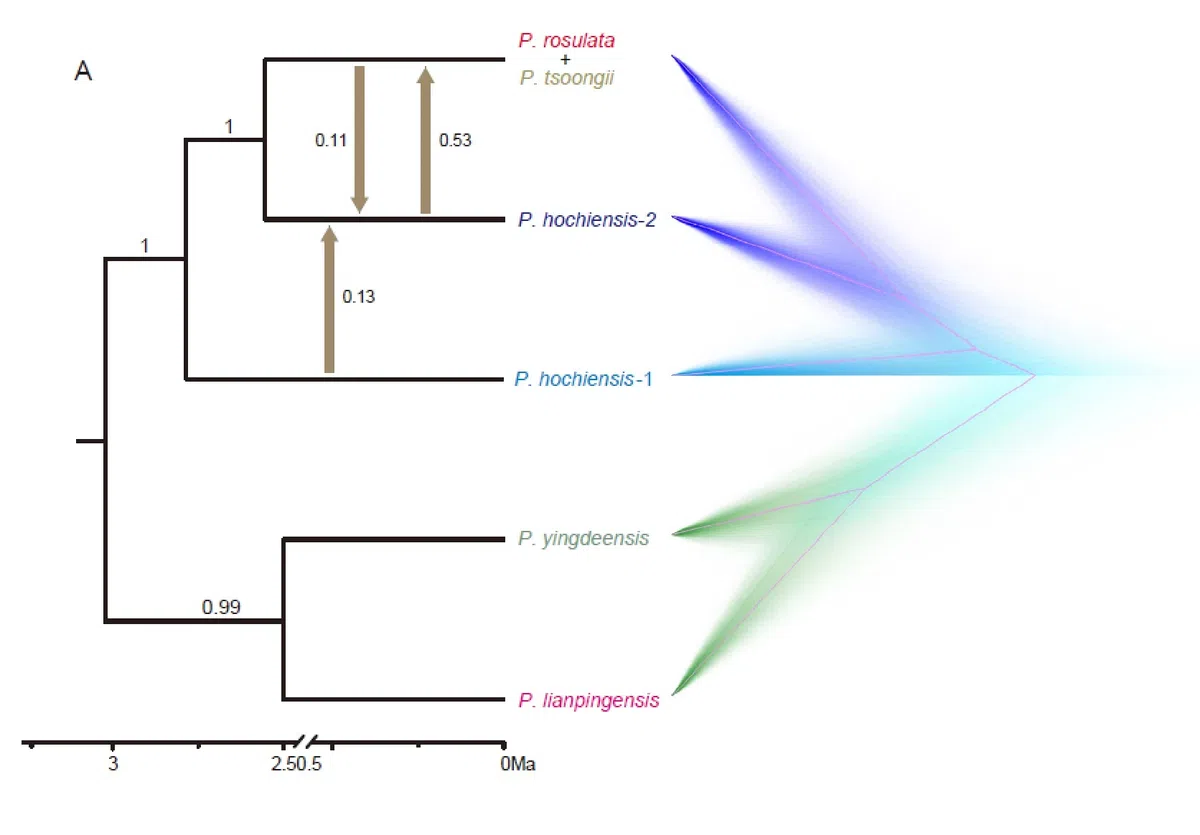
Figure 6Estimated gene flow (Nem) among species. The molecular dating species tree was constructed based on nuclear DNA data using the framework of the multispecies coalescent algorithm implemented in *BEAST: (A) Majority-rule consensus tree. Posterior probabilities are given at each node. The arrows denote gene flow among different species. (B) DensiTree visualization of consensus. The ‘root canal’ option was chosen to highlight the topology of the MCC tree (in pink). (For interpretation of the references to colour in this figure legend, the reader is referred to the web version of this article.)
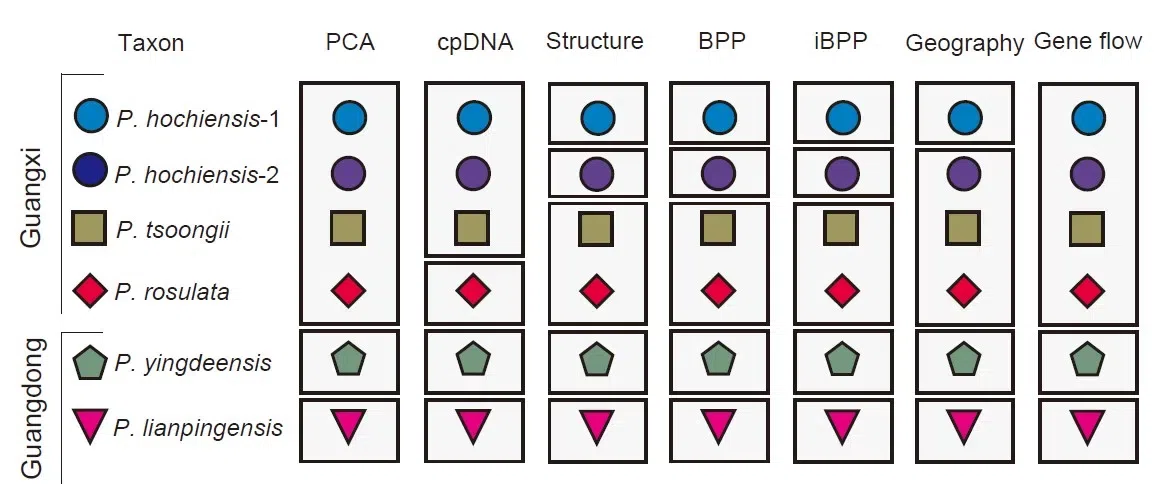
Figure 7 Summary of evidence supporting species delimitation hypotheses (columns) of the Primulina hochiensis complex. The complex includes five species which were split into Guangxi and Guangxi lineages according to geographic distribution.
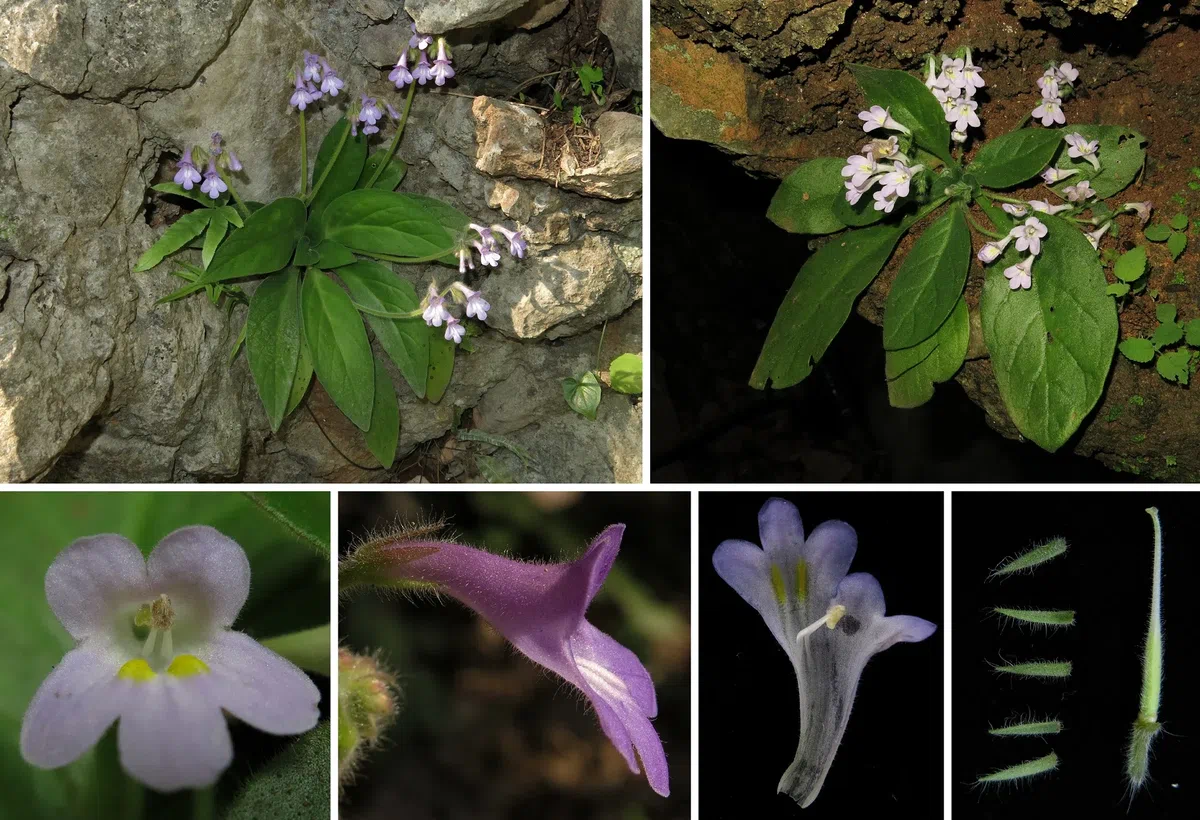
Figure 8 Primulina lianpingensis L.H. Yang, H.H. Kong & M. Kang sp. nov. (2019: 229) (Photoed by Lihua Yang)
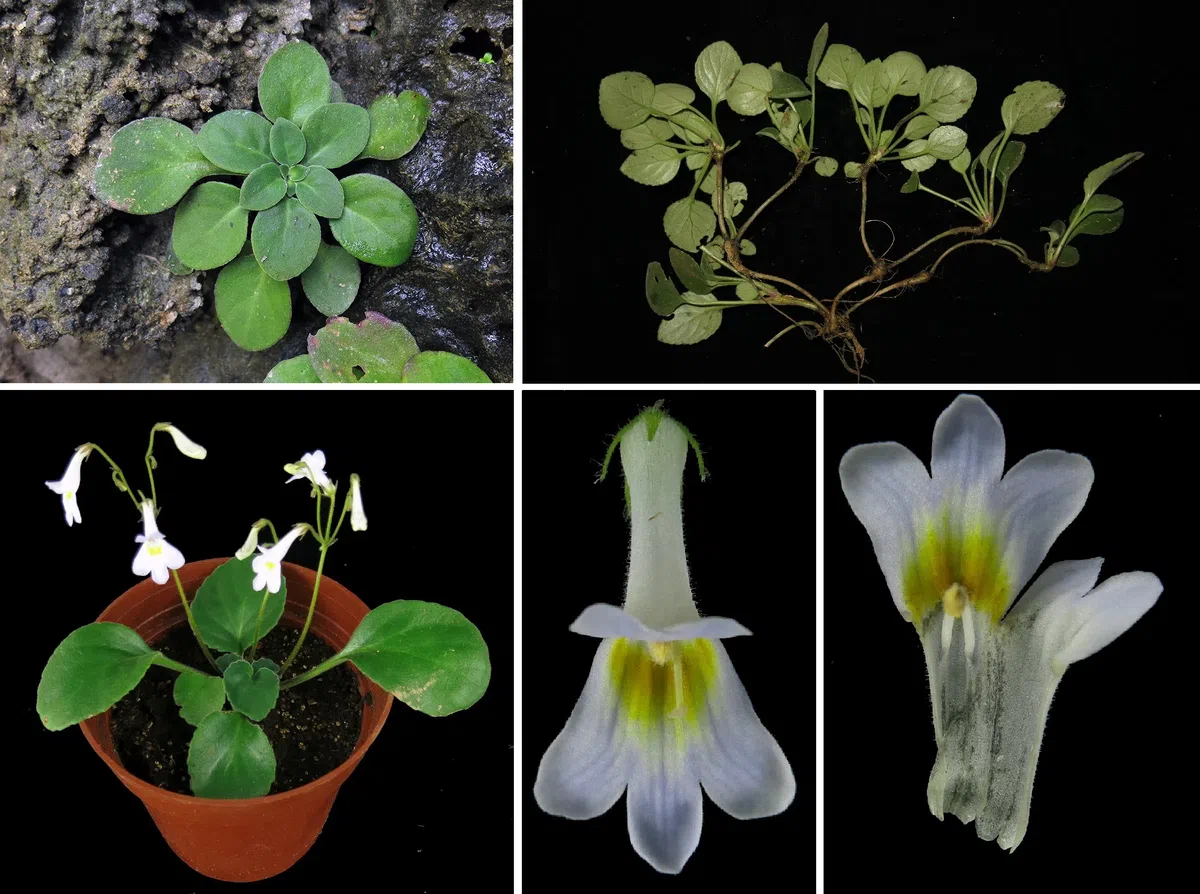
Figure 9Primulina hochiensis var. ovata L.H. Yang, H.H. Kong & M. Kang var. nov. (2019: 228)